Radiocarbon bomb spike
Eget arbete (Original text: Own work. Data from the following sources:)
- Manning, M.R., and W.H. Melhuish. 1994. Atmospheric 14C record from Wellington. In Trends: A Compendium of Data on Global Change. Carbon Dioxide Information Analysis Center, Oak Ridge National Laboratory, U.S. Department of Energy, Oak Ridge, Tenn., U.S.A.
- Levin, I., B. Kromer, H. Schoch-Fischer, M. Bruns, M. Münnich, D. Berdau, J.C. Vogel, and K.O. Münnich, 1994. δ14CO2 record from Vermunt. In Trends: A Compendium of Data on Global Change. Carbon Dioxide Information Analysis Center, Oak Ridge National Laboratory, U.S. Department of Energy, Oak Ridge, Tenn., U.S.A.
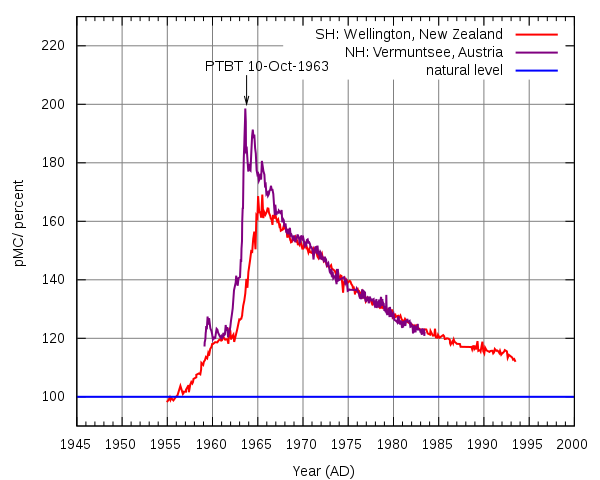
The figure shows the 14C / 12C ratio relative to the natural level in the atmospheric CO2 as a function of time in the second half of the 20th century.
The plot was generated with gnuplot from data of atmospheric radiocarbon in Wellington, New Zealand 1954AD to 1993AD and at the Vermuntsee, Austria 1959AD to 1983AD. The SVG file from gnuplot has been improved manually.
The data sources provide the data as D14C. For the plot the absolute percent modern value has been calculated assuming that each measurement was done in the same year as the respective sample was taken.All rights for generating the graphics shall be released. As far as I know there is no copyright protection on measurement data in general.
| Jag, upphovsrättsinnehavaren till detta verk, släpper detta verk i public domain. Detta gäller globalt. I vissa länder kan detta inte vara juridiskt möjligt; i så fall: Jag ger härmed envar rätten att använda detta verk för alla ändamål, utan några villkor, förutom villkor som lagen ställer. |
Mer information om licensen för bilden finns här. Senaste uppdateringen: Sat, 24 Dec 2022 09:04:29 GMT
